
Does Volume Reveal the Strength of a Gold Move?
Gold broke resistance, so you bought immediately. An hour later price was back below the level as if nothing had happened. Another time you saw an almost identical breakout and skipped it out of fear, and the rally ran $40. What was the difference between the two breakouts?
One of the most important answers sits below the chart, and few people look at it: the volume bars. In this article we explain what volume is in gold (XAUUSD), what your platform actually shows, how to use it to judge the strength of a move, and when it isn't enough on its own. It helps you read the strength behind gold's price moves.
What Is Trading Volume?
Volume is the amount traded during a given period. In the futures market, for example, volume counts all contracts traded, while open interest measures how many contracts are still open at the end of the day (CME Group).
The idea is simple: a move that many traders take part in with large size is usually more serious than a move made by a handful of orders.
What Does Volume Show on Your Platform?
This is a point many beginners miss. Spot gold (XAUUSD) doesn't trade on a single central exchange but over the counter. The London market, for example, is described as a decentralized OTC market, and even its published statistics don't represent the full trading volume (LBMA).
So the volume you see below the XAUUSD chart on most platforms is tick volume: the number of price changes during the candle at the price provider, not the number of real ounces traded worldwide. You can understand this difference better in gold CFDs.
Does that make tick volume useless? No. When real market activity increases, price changes more often, so tick volume usually rises. It is an approximate measure of activity, good enough to compare one candle with another on the same platform.
More Accurate Sources of Volume
If you want a number closer to actual volume, you can watch exchange-traded gold futures, whose main contracts together trade more than 300,000 contracts a day on average (CME Group). The CFTC also publishes the weekly Commitments of Traders report showing how open contracts are split among trader categories (CFTC).
How Does Volume Reveal the Strength of a Gold Move?
A Breakout on High Volume
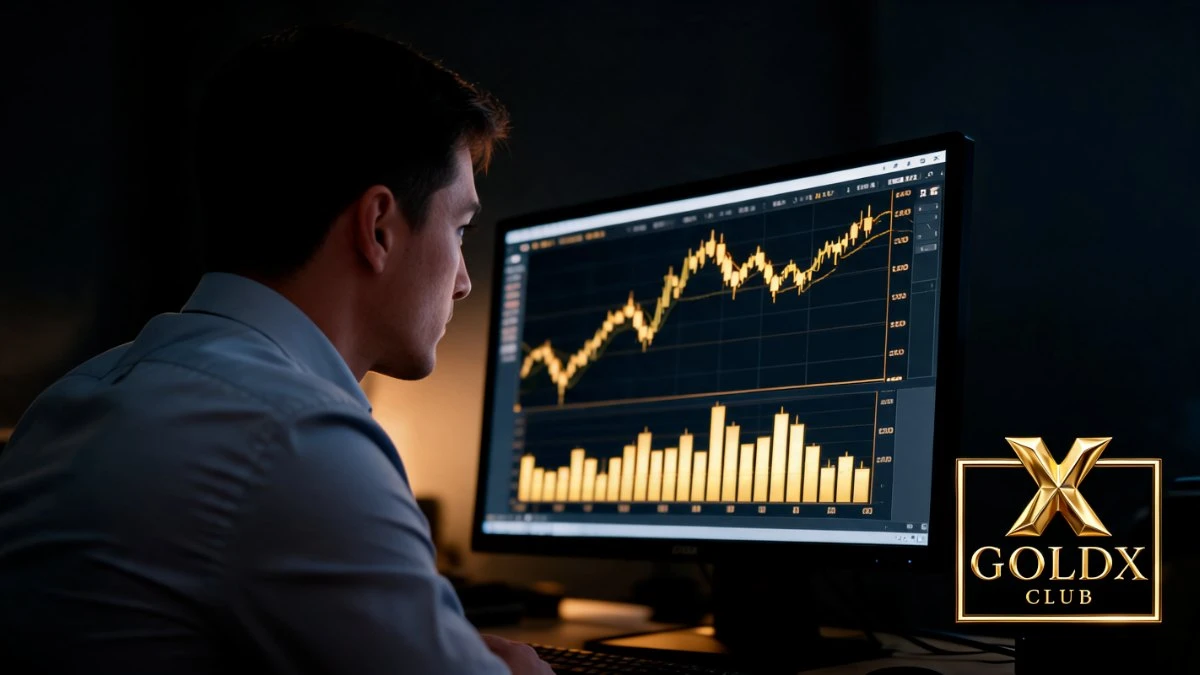
When price breaks a clear resistance and the volume bars under the candle are clearly higher than the average of previous candles, many orders took part in the break. The chance of continuation is higher here, especially if the following candles close above the level.
A Breakout on Weak Volume
If price moves above resistance with a single candle on below-average volume, the break may just be a run to the stop orders above the level followed by a return. This is one of the best-known signs of a false breakout, and it repeats often at the previous day high and low.
Volume Within a Trend
Volume isn't only useful at breakouts. In a healthy uptrend volume is usually:
- Higher on rising candles.
- Lower on pullback candles.
If falling candles start coming with more volume than rising ones, sellers are gaining strength and the trend may be weakening.
When price reaches supply and demand zones in gold, reading volume helps you see the reaction: rising volume with a clear rejection at a demand zone gives the zone more weight.
✅ Open a live gold trading account with our partner Traze, a licensed global broker, and get the GoldX Club books and courses as a gift.
Watch the Timing Before Judging Volume
Tick volume in gold changes a lot by session. It is usually lower in the Asian session, rises at the London open and then New York, and jumps sharply during major news. So don't compare a candle at the New York open with one at midnight.
The rule: compare volume with the average of candles at roughly the same time on previous days, or with the average of at least the last 20 candles. You'll find an explanation of each session's activity in the best time to trade gold.
One school that built its analysis on the relationship between price and volume is the Wyckoff method, which watches how volume changes during accumulation and distribution.
A Simple Example
Suppose gold on the 1-hour chart moved between $2,620 and $2,650 for three days, and the average tick volume of the last 20 candles was 6,000.
- Case one: price broke $2,650 with a candle of 14,000 volume and closed at $2,658, then the next candle pulled back to $2,652 on 5,000 volume. Waiting for the pullback and buying near $2,653 with a stop below $2,644 is a logical option.
- Case two: price broke $2,650 with a candle of only 4,500 volume and closed with a long wick at $2,649. Here it is better to wait, since price may return inside the range.
But this scenario won't always work: a high-volume breakout can fail, and a low-volume breakout can continue. Volume only raises or lowers the probability, and the numbers are for illustration.
Common Mistakes When Reading Volume
- Treating tick volume as the real volume of the entire gold market.
- Comparing the volume of a quiet session with volume during news.
- Buying just because a big volume bar appears, without looking at where price is.
- Ignoring the higher-timeframe trend and relying on volume alone.
- Comparing volume between two different platforms.
The Fix: Make Volume a Witness, Not a Judge
Volume alone doesn't tell you where to enter, but it tells you whether the move you see is supported or not. Set the level first, then look at volume when price reaches it: a break on high volume with a clear close, or a weak push with a long wick? This simple question will help you avoid many false breakouts.
This article gives you the idea. The full strategies we apply to gold, with clear entry and exit rules, many examples and practical exercises, are in our books Gold Trading for Beginners and The Pro Gold Trading Encyclopedia on the GoldX Club home page. Want to start for free? Download XAUUSD Liquidity Map.
When you are ready to apply this on a live account, start small with a trusted broker:
✅ Prefer another broker? Open your account with XM, a globally regulated broker, and check the offers available when you register.
Summary
- Volume measures the amount of activity during a candle.
- The volume on most XAUUSD platforms is approximate tick volume, not total market volume.
- A breakout on high volume with a clear close is usually stronger than one on weak volume.
- In a healthy trend volume rises with the move and falls on pullbacks.
- Compare volume with the same time on previous days, and use it with levels, not alone.
FAQ
◆ Is the volume on a gold trading platform real?
On most platforms it is tick volume, counting price changes at the price provider. It is an approximate measure of activity, not the volume of the entire market.
◆ How do I know a breakout is strong using volume?
When the breakout candle's volume is clearly above the average of previous candles and the following candles close beyond the level.
◆ Is volume enough on its own to enter a trade?
No. Volume is a confirmation tool used together with levels, the trend and risk management.
◆ Why does volume differ between platforms?
Because each platform relies on a different price provider, so the number of price changes recorded in a candle differs.
◆ Where can I find more accurate gold market volume?
You can watch exchange-traded gold futures volume and the weekly Commitments of Traders reports, keeping in mind that they cover the futures market.
This content is for education only and is not investment advice. Trading financial markets carries a high level of risk, and you may lose some or all of your capital.
Disclaimer and Risk Warning: This website and everything it offers is educational content only. It is not investment advice or a recommendation to buy or sell, and GoldX Club and its team accept no responsibility for any losses or damages, direct or indirect, or for decisions you make based on any content we provide, in any form or through any channel. GoldX Club is an independent educational platform; it is not a broker and does not receive or manage client funds. Trading and investing in financial markets carries a high level of risk and may result in the loss of some or all of the capital invested. Prices of assets, currencies and gold are subject to rapid volatility and may not be suitable for all investors. You should assess your own knowledge, experience and investment objectives, and never risk money you cannot afford to lose. Links to our approved partners on this site are partner links, and we may receive a commission from the broker when a client registers through them, at no extra cost to the client. Clients who register through our links may receive exclusive benefits, competitive spreads, dedicated support and bonuses where the broker's rules and the client's country allow, subject to each broker's terms.
© 2026 GoldX Club. All rights reserved.