
Market Structure on the Gold Chart: BOS and Trend
You buy gold because "the trend is up", and price drops hard. You sell because you see a decline, and it bounces and rallies. It feels like the trend changes every time you enter.
The problem is usually that you judge the trend from the last two candles, not from market structure. In this guide we explain how to read structure in a simple, clear way.
What Is Market Structure?
Market structure is the sequence of highs and lows on the chart:
- Uptrend: higher highs and higher lows.
- Downtrend: lower highs and lower lows.
- Range: highs and lows close together with no clear direction.
The idea is old and simple, but its power is in applying it with discipline. A study from MIT suggests that technical patterns based on the shape of price movement may carry useful information when analyzed systematically (MIT).
What Is a Break of Structure (BOS)?
BOS stands for break of structure. In an uptrend it happens when price breaks the last high and closes above it, confirming that the trend continues.
In a downtrend it happens when price breaks the last low and closes below it.
What Is a Change of Character (CHoCH)?
CHoCH stands for change of character. It is the first sign that the trend may change:
- In an uptrend: price breaks the last higher low instead of the high.
- In a downtrend: price breaks the last lower high.
But be careful: a CHoCH alone is not an entry signal, just a warning to wait for confirmation.
How to Tell a Real Break From a Liquidity Grab
Not every break of a high is a break of structure. Sometimes price breaks the high with a quick wick to take the liquidity above it, then returns below it. That is not a BOS but a liquidity grab.
- Real break: a candle closes with a clear body beyond the level, followed by continuation.
- Liquidity grab: a wick beyond the level, then a close back inside it, often followed by a fast reversal.
✅ Open a live gold trading account with our partner Traze, a licensed global broker, and get the GoldX Club books and courses as a gift.
Choose the Right Timeframe
Structure on the 1-minute chart changes every hour, while structure on the 4-hour and daily charts sets the real trend. So:
- Set the trend from the higher timeframe.
- Look for a CHoCH on a lower timeframe in the direction of the higher timeframe.
- Enter from a zone such as a fair value gap or an order block formed with the break.
A Simple Example on the Gold Chart
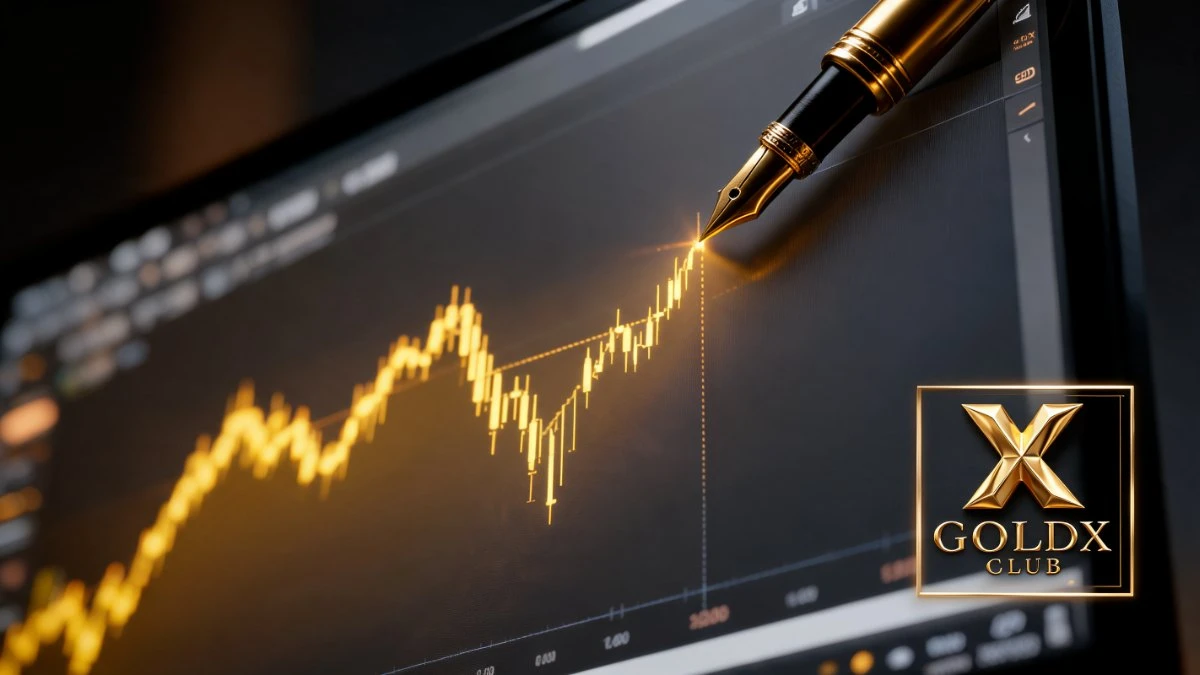
Gold is in an uptrend on the 4-hour chart. On the 15-minute chart price drops and takes liquidity below a previous low, then rallies and breaks the last lower high: a bullish CHoCH. Price returns to a gap formed with the break, and the trader buys with a stop below the low whose liquidity was taken, using a size set by the rules of money management.
Common Market Structure Mistakes
- Judging the trend from a very low timeframe.
- Treating every wick through a high as a break of structure.
- Entering right after a CHoCH without waiting for price to come back.
- Marking tiny highs and lows that mean nothing.
Frequent trading on low timeframes raises costs and mistakes: research from UC Berkeley on day traders shows that only a very small share of them earn consistent results after costs (UC Berkeley).
The Fix: Structure First, Then the Zone, Then the Entry
When you start every analysis by asking "what is the structure on the higher timeframe?", you stop trading against the trend without realizing it. Then you use liquidity and zones to choose your entry, and protect yourself from the costs of repeated entries such as the spread.
This article gives you the idea. The full strategies we apply to gold, with clear entry and exit rules, many examples and practical exercises, are in our books Gold Trading for Beginners and The Pro Gold Trading Encyclopedia on the GoldX Club home page. Want to start for free? Download XAUUSD Liquidity Map.
When you are ready to apply this on a live account, start small with a trusted broker:
✅ Prefer another broker? Open your account with XM, a globally regulated broker, and check the offers available when you register.
Summary
- An uptrend has higher highs and lows; a downtrend has lower highs and lows.
- A BOS confirms the trend continues with a clear close.
- A CHoCH is the first sign the trend may change.
- A wick that breaks and returns is usually a liquidity grab, not a break of structure.
- Set the trend on the higher timeframe and enter on the lower one.
FAQ
◆ What does BOS mean in trading?
BOS stands for break of structure. It happens when price breaks the last high in an uptrend, or the last low in a downtrend, and closes beyond it.
◆ What does CHoCH mean?
It stands for change of character, the first break against the current trend, which warns that the trend may change.
◆ What is the difference between BOS and CHoCH?
A BOS confirms that the current trend continues, while a CHoCH points to a possible reversal.
◆ What is the best timeframe for market structure in gold?
The 4-hour and daily charts to set the overall trend, then lower timeframes to time the entry.
◆ Does every break of a high mean the rally will continue?
No. If price breaks the high with a wick only and closes below it, it usually took liquidity and may reverse.
This content is for education only and is not investment advice. Trading financial markets carries a high level of risk, and you may lose some or all of your capital.
Disclaimer and Risk Warning: This website and everything it offers is educational content only. It is not investment advice or a recommendation to buy or sell, and GoldX Club and its team accept no responsibility for any losses or damages, direct or indirect, or for decisions you make based on any content we provide, in any form or through any channel. GoldX Club is an independent educational platform; it is not a broker and does not receive or manage client funds. Trading and investing in financial markets carries a high level of risk and may result in the loss of some or all of the capital invested. Prices of assets, currencies and gold are subject to rapid volatility and may not be suitable for all investors. You should assess your own knowledge, experience and investment objectives, and never risk money you cannot afford to lose. Links to our approved partners on this site are partner links, and we may receive a commission from the broker when a client registers through them, at no extra cost to the client. Clients who register through our links may receive exclusive benefits, competitive spreads, dedicated support and bonuses where the broker's rules and the client's country allow, subject to each broker's terms.
© 2026 GoldX Club. All rights reserved.