
Internal and External Liquidity in Gold
You see the gold price rally hard toward a clear high, so you buy because "the breakout has come". Minutes later price reverses, hits your stop loss, then keeps falling against your trade. This happens to most beginner traders, and the reason is rarely luck. The reason is that they read the high as a resistance line only, when it is really a pool of liquidity. Understanding internal and external liquidity in gold changes how you read the chart: you learn why price goes to the high, what it looks for after taking it, and where your entry and stop make more sense.
Why Does Price Hit the High, Then Turn Against You?
Every clear high on the chart is seen by thousands of traders at the same moment. The seller who entered below it places a stop loss above it, and the buyer waiting for the breakout places a pending buy order above it too. The result: a large amount of buy orders ready to fill builds up above the high. According to the US Securities and Exchange Commission's definition, a stop order becomes a market order once price reaches its level, and it may fill far from that level in fast moves (Investor.gov).
Institutions that need to sell large amounts don't find enough opposite orders in the middle of the range. They find them above the high, where stop orders turn into buy orders all at once. That's why price often spikes above the high with a fast candle, then falls back below it. Whoever bought late becomes the liquidity the move needed. You'll find the details of this mechanism in our article on stop loss hunting in gold.
What Is Internal and External Liquidity in Gold?
Before you ask where price will go, ask: where are the orders? If the idea is new to you, start with liquidity in gold trading. We split liquidity on the XAUUSD chart into two types, based on where it sits relative to the range price is moving in.
External liquidity: above highs and below lows
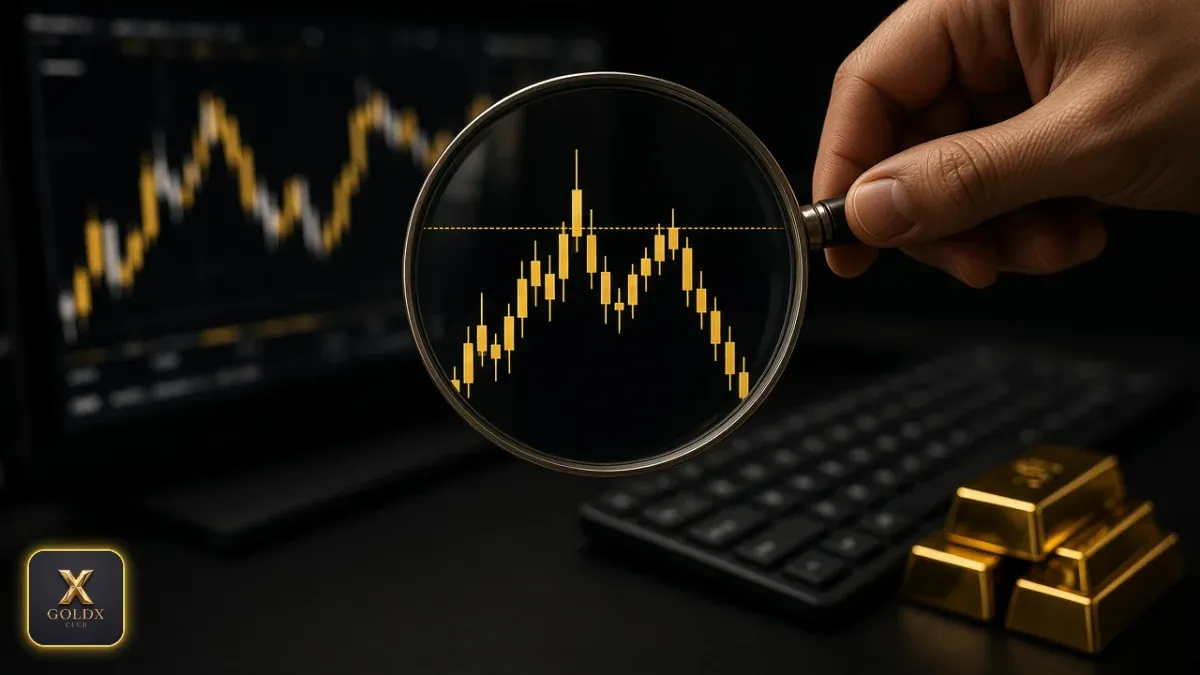
These are the orders building up outside the range: above the last high and below the last low. Its clearest forms are equal highs and lows, the previous day's high and low, and weekly highs. The clearer and more often tested a high is, the more orders sit above it, and the more likely price is to visit it.
Internal liquidity: gaps and zones inside the range
These are the zones inside the range that price left unbalanced, the best known being the fair value gap (FVG): three candles where the middle one leaves a void that price didn't trade through enough. Price often returns to these zones to fill them before continuing. This idea is close to the zones we explained in market structure in gold.
| Comparison | External liquidity | Internal liquidity |
|---|---|---|
| Location | Above highs and below lows | Inside the range (FVGs and imbalance zones) |
| What it holds | Stop orders and pending breakout orders | A price void that needs rebalancing |
| Typical price behavior | Takes it, then decides: rejection or acceptance | Returns to it, then continues toward new external liquidity |
Where Does the Gold Price Go After Taking the High?
The general rule that helps you order things: price moves from external liquidity to internal liquidity, then to external liquidity on the opposite side. After the high is taken you face two main scenarios, and what decides between them is the candle close, not the wick.
Scenario 1: the high is taken, then price returns inside
A wick appears above the high, then the candle closes below it, often with above-average volume. Here price took the external liquidity and didn't accept staying above it. The next logical target is the nearest internal liquidity below, such as an FVG left by the earlier rally. After that, the external liquidity below the previous low becomes the next likely destination. Many call this a false breakout.
Scenario 2: a real breakout with acceptance above the high
One or more candles close clearly above the high, then price comes back to test it from above and bounces higher instead of sinking below it. Here the old high has turned into support, and price is looking for the next external liquidity above, such as the previous day's or week's high. It may first return to fill a small internal gap left by the breakout itself before continuing.
✅ Open a live gold trading account with our partner Traze, a licensed global broker, and get the GoldX Club books and courses as a gift.
Reading the Chart Step by Step
Here is a typical sequence, step by step:
- ① A fast rally leaves an FVG inside the range. This is internal liquidity price will likely return to later.
- ② Three very close highs form equal highs. Above them build sellers' stops and breakout buy orders, that is, clear external liquidity.
- ③ A candle with a long wick above the highs closes below them with the highest volume of the session. Price took the liquidity and refused to stay above it.
- ④ The drop heads to the FVG zone, meaning price moved from external to internal liquidity.
- ⑤ If the gap doesn't hold, the external liquidity below the previous low becomes the next likely target.
Note that the reading relied on the wick, the close and the volume together, not on the wick alone.
Where to place your stop loss after the high is taken
The common mistake is placing the stop just above the old high, the very place price has just taken. In the return-inside scenario, the more logical place for the stop is above the top of the sweep wick itself, with a buffer that suits gold's volatility on your timeframe, because price getting back above that wick means your reading is wrong. In the real-breakout scenario, the stop goes below the last low formed after the breakout, not a few points below the old high. And remember that a stop may fill at a worse price than its level during news and fast moves, as explained in types of orders on Investor.gov. For more, see where to place your stop loss in gold.
Common Mistakes When Reading Liquidity
- Entering on a wick that hasn't closed yet: wait for the candle close. A wick before the close can turn into a full body above the high.
- Ignoring the higher timeframe: a high taken on the 5-minute chart inside a strong uptrend on the 4-hour chart may cause no more than a small pullback.
- Treating every gap as a target: what matters most are the gaps close to the current price and in the direction of the move. Don't mark every void on the chart.
- Ignoring news timing: US jobs data and rate decisions move markets so fast that liquidity sweeps become more violent than usual.
- Mixing instruments: a gold futures chart differs in timing and liquidity from the spot price, so stick to one source when analyzing.
If you're still at the start of the road, begin with how to read a gold chart before moving on to liquidity concepts. To follow the price live, use the gold price today page. And if you want to know how large traders are positioned each week, the Commitments of Traders report from the US Commodity Futures Trading Commission (CFTC) is a useful official reference for the big picture.
From Understanding to Practice
Reading liquidity is a skill built by repetition on the chart, not by memorizing definitions. Start by marking equal highs and lows on the 1-hour chart every day, then watch what price does there: does it take them and come back, or close above and stay? Write down your notes, and you'll see the pattern repeat.
To speed up this stage, download our free gold trading books. Those who want to go deeper into how institutions build positions around liquidity zones will find it in detail in The Pro Gold Trading Encyclopedia and the Whale Footprint course in our books and courses. And browse more content from the GoldX Club home page.
✅ Prefer another broker? Open your account with XM, a globally regulated broker, and check the offers available when you register.
Summary
- A high on the chart isn't just resistance; it is a store of stop orders and breakout orders, that is, external liquidity.
- Internal liquidity is the gaps and imbalance zones inside the range, and price often returns to them.
- The usual sequence: external liquidity → internal liquidity → external liquidity on the opposite side.
- A wick above the high with a close below it and high volume favors a return inside. A close and hold above it favors a real breakout.
- Place your stop beyond the sweep wick or beyond the last low after the breakout, not at the old high.
- Nothing is certain in the markets. Liquidity gives you clearer probabilities, and risk management is what protects you.
FAQ
◆ What is the difference between internal and external liquidity in gold?
External liquidity is the orders building up above highs and below lows outside the range, and internal liquidity is the gaps and imbalance zones inside the range that price returns to fill.
◆ Where does the gold price go after taking the high?
If the candle closes below the high after the wick, price usually heads to the nearest internal liquidity such as an FVG, then to the external liquidity below the previous low. If it closes and holds above it, it is more likely a real breakout targeting a higher high.
◆ How do I tell a liquidity sweep from a real breakout?
Look at the close, not the wick: a close below the high with high volume points to a liquidity sweep, while a close above it followed by a successful retest from above points to acceptance and a real breakout.
◆ Where do I place my stop loss after the high is taken?
In the return scenario, place the stop above the top of the sweep wick with a buffer that suits gold's volatility; in the breakout scenario, place it below the last low formed after the breakout, not right at the old high.
◆ Do liquidity concepts work on all timeframes?
Yes, but they get stronger on higher timeframes. Taking a daily or weekly high matters far more than taking a high on the 1-minute chart, so always tie your reading to the trend on the higher timeframe.
Eng. Bashar Shaaban · Founder of GoldX Club. Oil and gas engineer, technical analyst and global financial markets specialist with more than 15 years of experience trading gold and currencies. Member of the American Association of Professional Technical Analysts and a contributing writer at Investing.com since 2019. About the author and our editorial policy →
This content is for education only and is not investment advice. Trading financial markets carries a high level of risk, and you may lose some or all of your capital.
Disclaimer and Risk Warning: This website and everything it offers is educational content only. It is not investment advice or a recommendation to buy or sell, and GoldX Club and its team accept no responsibility for any losses or damages, direct or indirect, or for decisions you make based on any content we provide, in any form or through any channel. GoldX Club is an independent educational platform; it is not a broker and does not receive or manage client funds. Trading and investing in financial markets carries a high level of risk and may result in the loss of some or all of the capital invested. Prices of assets, currencies and gold are subject to rapid volatility and may not be suitable for all investors. You should assess your own knowledge, experience and investment objectives, and never risk money you cannot afford to lose. Links to our approved partners on this site are partner links, and we may receive a commission from the broker when a client registers through them, at no extra cost to the client. Clients who register through our links may receive exclusive benefits, competitive spreads, dedicated support and bonuses where the broker's rules and the client's country allow, subject to each broker's terms.
© 2026 GoldX Club. All rights reserved.